AI & Software Architecture / A developer’s perspective
Is Your AI Agent Stupid, or Is Your Project Hard to See?
The agent edits the right file, writes a plausible fix, and misses a connection that feels obvious to you. Before calling it stupid, ask a more useful question: where could it have discovered what you already knew?
The connection was obvious. To you.
Imagine asking an agent to change the response of an endpoint. It finds the handler, adjusts the returned data, and reports success. You open the page and immediately notice the missing piece: another consumer expected the old shape. You knew that consumer existed because you built it six months ago. The agent’s patch never mentions it.
This is an illustrative failure, not a measured incident or a claim that every agent behaves the same way. But it exposes a useful distinction. Your understanding of a project contains more than the file on screen. It includes naming conventions, previous migrations, rejected designs, operational surprises, and relationships you no longer need to look up.
A repository can contain the evidence for a relationship without making it easy to discover. A class name in an import, an attribute on a payload, a contract binding, and a test fixture may each reveal part of the story. If a task begins with one matching filename, it is easy to mistake that fragment for the whole change surface.
Agents can still make reasoning mistakes after receiving good evidence. Models, tools, instructions, and verification all matter. Yet “the agent is stupid” does not tell you whether the missing step was discovery, interpretation, or checking the result. Following the evidence does.
What does an agent actually see?
For a coding task, distinguish three things: the repository on disk, the tools available to inspect it, and the information currently supplied to the model. They are related, but they are not interchangeable. Permission to read a repository does not mean every relevant file has already been read.
An agent can assemble context incrementally: inspect an entry point, query its relationships, open the relevant source, then check a test or runtime trace. The useful question is whether that process can find the evidence needed for this task. Anthropic’s context engineering guidance describes context as a finite resource and discusses retrieving relevant information through tools as work proceeds.
That makes project structure practical. A descriptive filename helps locate a component. A typed relationship explains why another component matters. A source location lets you check the claim. A recorded limitation tells you when an empty result should trigger further investigation.
“See the project like an agent” means auditing accessible evidence. It does not mean visualizing a model’s internal reasoning. A project graph is an external map that a person or agent can consult; it is not a picture of what an LLM thinks.
Try this small exercise: pick a change you understand well, then set aside your memory of the project. Starting from the request alone, where would you discover the affected handler? Its callers? Its output contract? The behavior that must stay intact? Wherever you answer “I just know,” you have found context worth making discoverable.
A shared map: the new visual Project Graph
Semitexa’s new Graph view in the Observatory puts the project’s indexed structure on screen. The left panel starts with routes, commands, and handlers. The center draws the selected node’s neighborhood. The right panel explains its relationships and points back to source and recorded traces. Search provides another entry when you already know a class name.
The important part is the connection between these views. You can begin with a route, expand to its payload and handler, then investigate the handler’s dependencies. You can inspect a node without losing the wider picture, or refocus the graph when that node becomes the next question.
The CLI remains useful for agents and repeatable queries. The visual view gives a developer a way to examine the same indexed structural relationships. That creates a shared object for discussion: which edge supports the proposed change, which dependency needs attention, and which claim still requires source or runtime evidence?
About these screenshots. Captured on October 1, 2026, from the running Semitexa development workspace at a 1600 × 1000 viewport. They demonstrate the implemented viewer, not confirmed availability on a public deployment. Repository counts describe this snapshot. Each image links to its full size.
Start from a real route, not a guessed filename
Open /__observatory in a local development environment and choose graph in the header; G switches views as well. Expand Routes, find GET /__observatory, and expand that entry. The tree reveals ObservatoryPayload, followed by ObservatoryHandler.
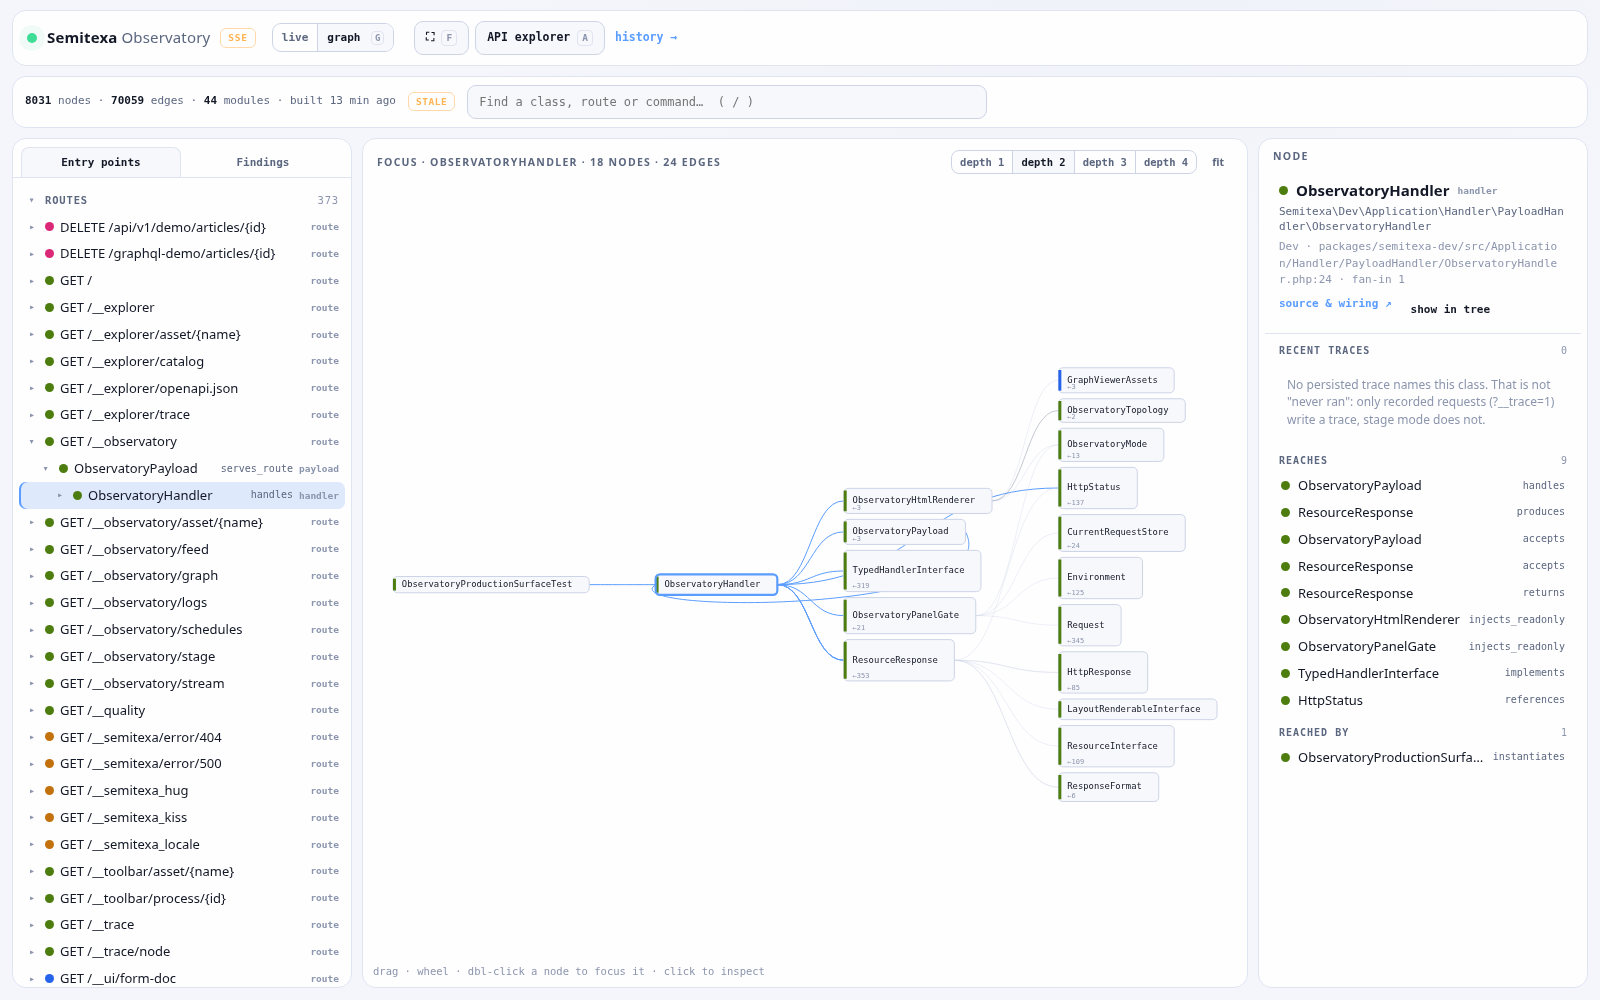
serves_route and the payload-to-handler relationship handles.Those labels carry more information than a text match. They say how the components relate. They also give a reader a checkable claim: open the payload’s route declaration and the handler’s metadata, then compare them with the graph. The request-to-HTML article explains the wider payload, handler, resource, and template lifecycle.
If the task is “change how the Observatory page opens,” this path is a concrete starting point. It does not yet prove that the handler is the correct place to edit. It identifies a relevant execution boundary and lets you ask the next question with a real symbol.
Read dependencies and dependents in both directions
Select ObservatoryHandler, or search for it and press Enter. The focus view places direct dependents on the left and dependencies on the right. Depth controls expand the neighborhood from one to four steps. Each class is drawn once in this view, so several paths reaching one dependency remain visible as connections to the same node.
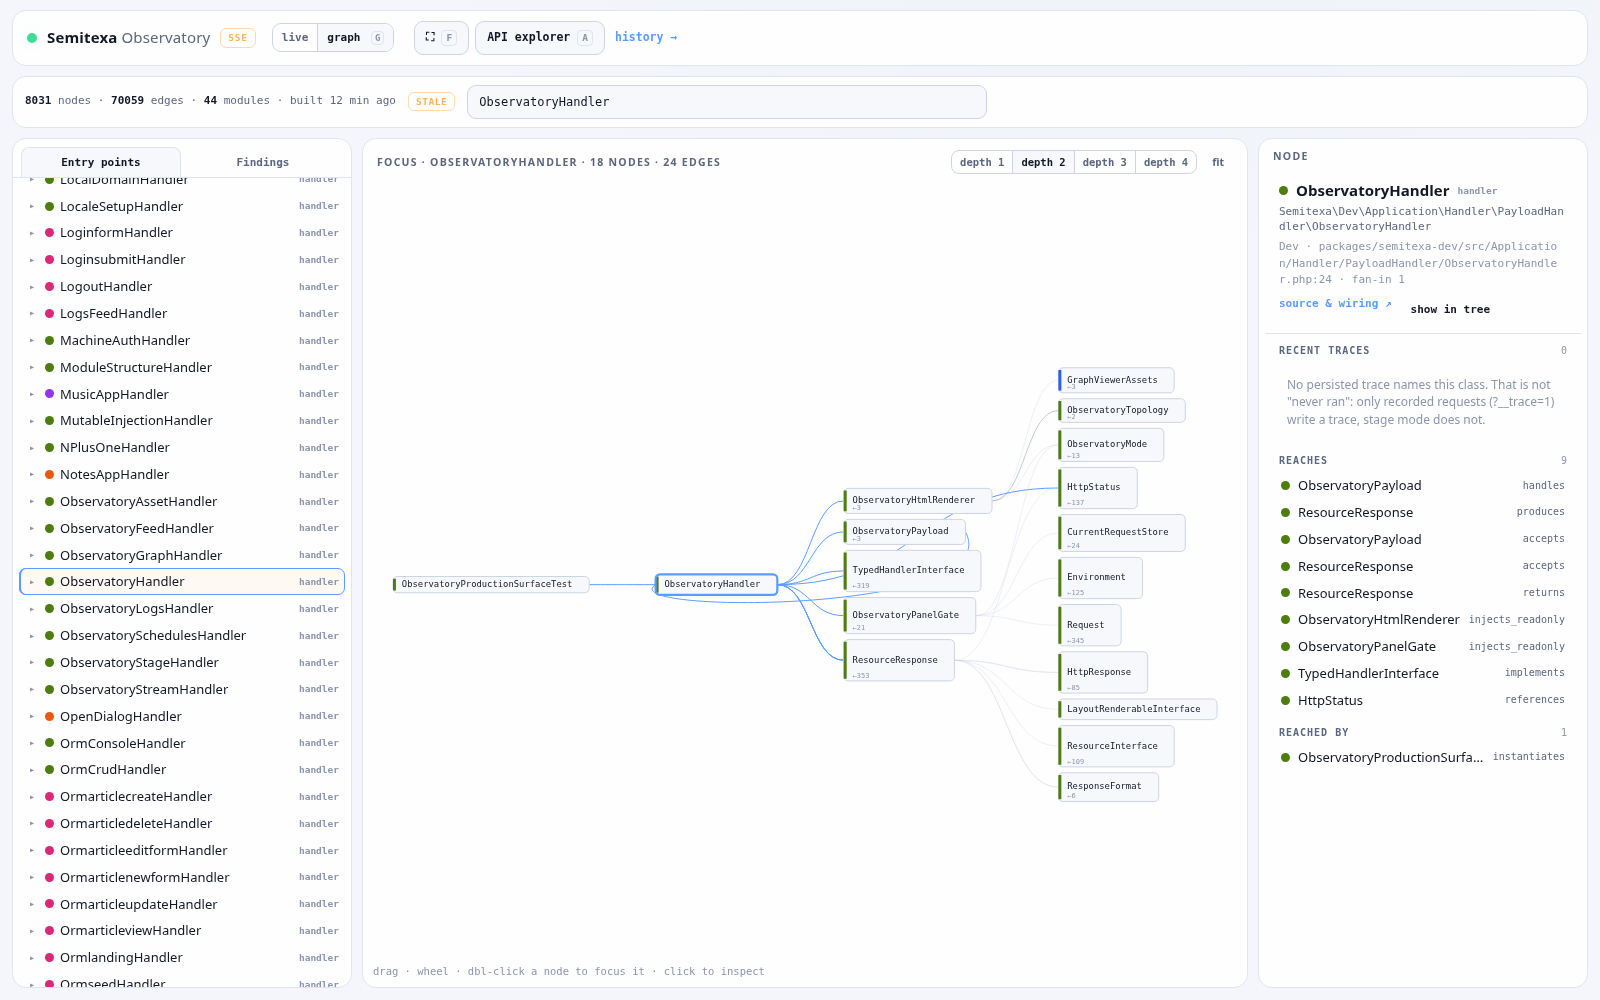
ObservatoryHandler. The right panel distinguishes injects_readonly, accepts, returns, and implements; nearby nodes are not all equivalent dependencies.In this example, the handler has injection relationships to ObservatoryHtmlRenderer and ObservatoryPanelGate. It handles and accepts ObservatoryPayload, returns a ResourceResponse, and implements TypedHandlerInterface. The CLI query independently exposes those indexed relationships:
bin/semitexa ai:review-graph:query \
  --dependencies='Semitexa\Dev\Application\Handler\PayloadHandler\ObservatoryHandler' \
  --compact --json
Now a proposed UI change has better questions attached to it. Is the output assembled in the renderer? Is access decided by the panel gate? Does the change alter the payload or the response? The graph narrows where to read; source and behavior determine the answer.
Looking left matters too. A test that instantiates the handler is visible in this snapshot. That is a clue for verification, not a complete test plan. More generally, a caller or shared interface can reveal why an apparently local edit needs a wider check. The earlier Project Graph CLI guide covers usage and impact queries in more detail.
Read the gaps with the same attention as the edges
These screenshots deliberately retain the STALE indicator: the code had changed since the displayed graph was built. That status is part of the evidence. Rebuild before treating the displayed structure as current:
bin/semitexa ai:review-graph:generate --jsonFreshness and coverage are separate questions. A recently built graph can still contain dynamic references, unresolved symbols, excluded files, or duplicate class declarations. The findings panel makes these limits visible alongside candidate unused classes and loops.
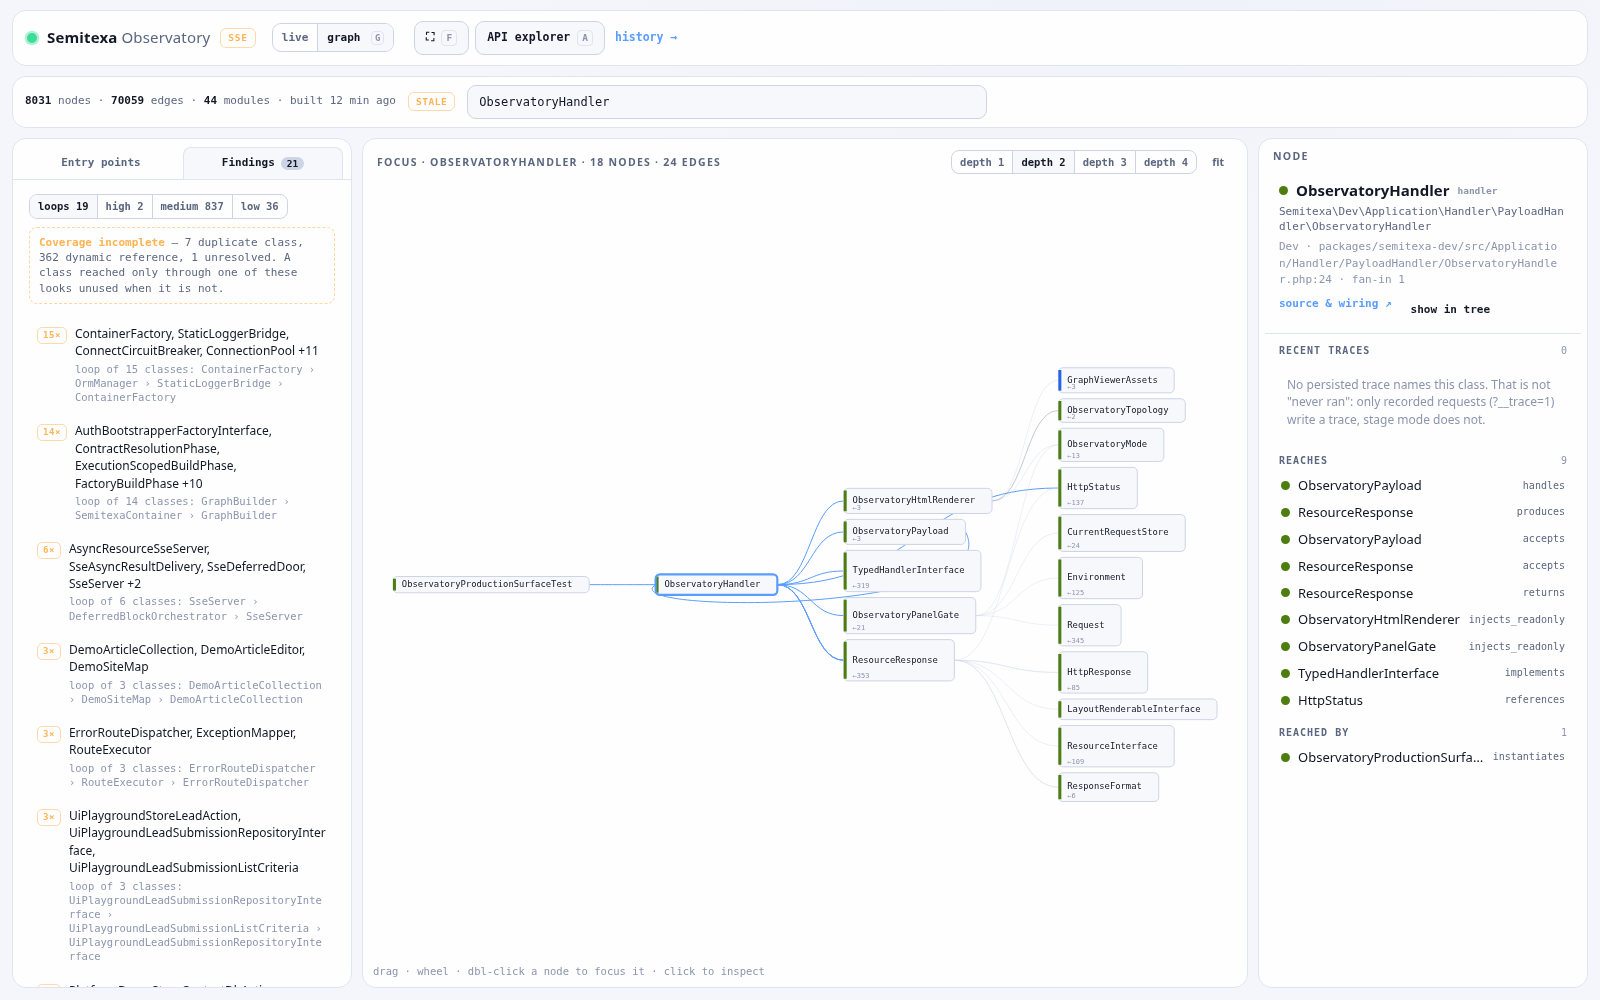
The dependency query used here reports complete: false and absence_is_proof: false. An empty list of users cannot establish that a class has no runtime consumer. Check the relevant gaps, configuration, and execution path before making that conclusion.
The same care applies to recent traces. An empty panel means no persisted trace names this class. Requests must have been recorded for those links to exist; absence of a recorded trace does not mean the code never ran. A trace shows observed execution, while the graph shows indexed structure. Neither alone proves every possible behavior.
This is an essential part of teaching agents to investigate: ask them to report what the tool knows, what it did not resolve, and which conclusion is still an inference. A precise uncertainty is more useful than a confident claim based on an incomplete map.
Give the next task a starting point it can defend
Compare “fix this page” with a request that names the failing behavior, the route, and the condition that must remain true. The second gives an agent a way to choose an entry point and evaluate the result. You do not need to supply every file; you need to make the investigation possible.
Investigate GET /__observatory in local dev mode.
Follow the payload to its handler and inspect dependencies.
Check graph freshness and relevant coverage gaps.
Explain where the proposed UI change belongs before editing.
Preserve the existing access behavior.
Verify the affected behavior and report any skipped checks.
This is an investigation brief, not a report that a particular defect exists. It asks for a chain of evidence before implementation. If the graph points to a renderer, read the renderer. If a contract changes, inspect its users. If the result depends on runtime state, exercise that path. If verification skipped a check, say so.
Keep project instructions focused on enduring boundaries and how to verify them. Keep task-specific findings in durable work records. Let the graph answer structural questions and exact source search answer textual ones. This gives the next session a route back to the evidence without requiring it to reconstruct every decision from conversation history.
The next time an agent misses an “obvious” dependency, use the visual graph together. Find the entry point, inspect the edge, open the source, and check the behavior. You may discover a model mistake, a weak tool result, or knowledge that existed only in your head. Each has a different remedy. A project you can investigate makes that distinction visible.
Once the agent proposes a change, the developer needs a reason to accept it. The cognitive surrender article follows that review from a convincing explanation to evidence you can assess.
